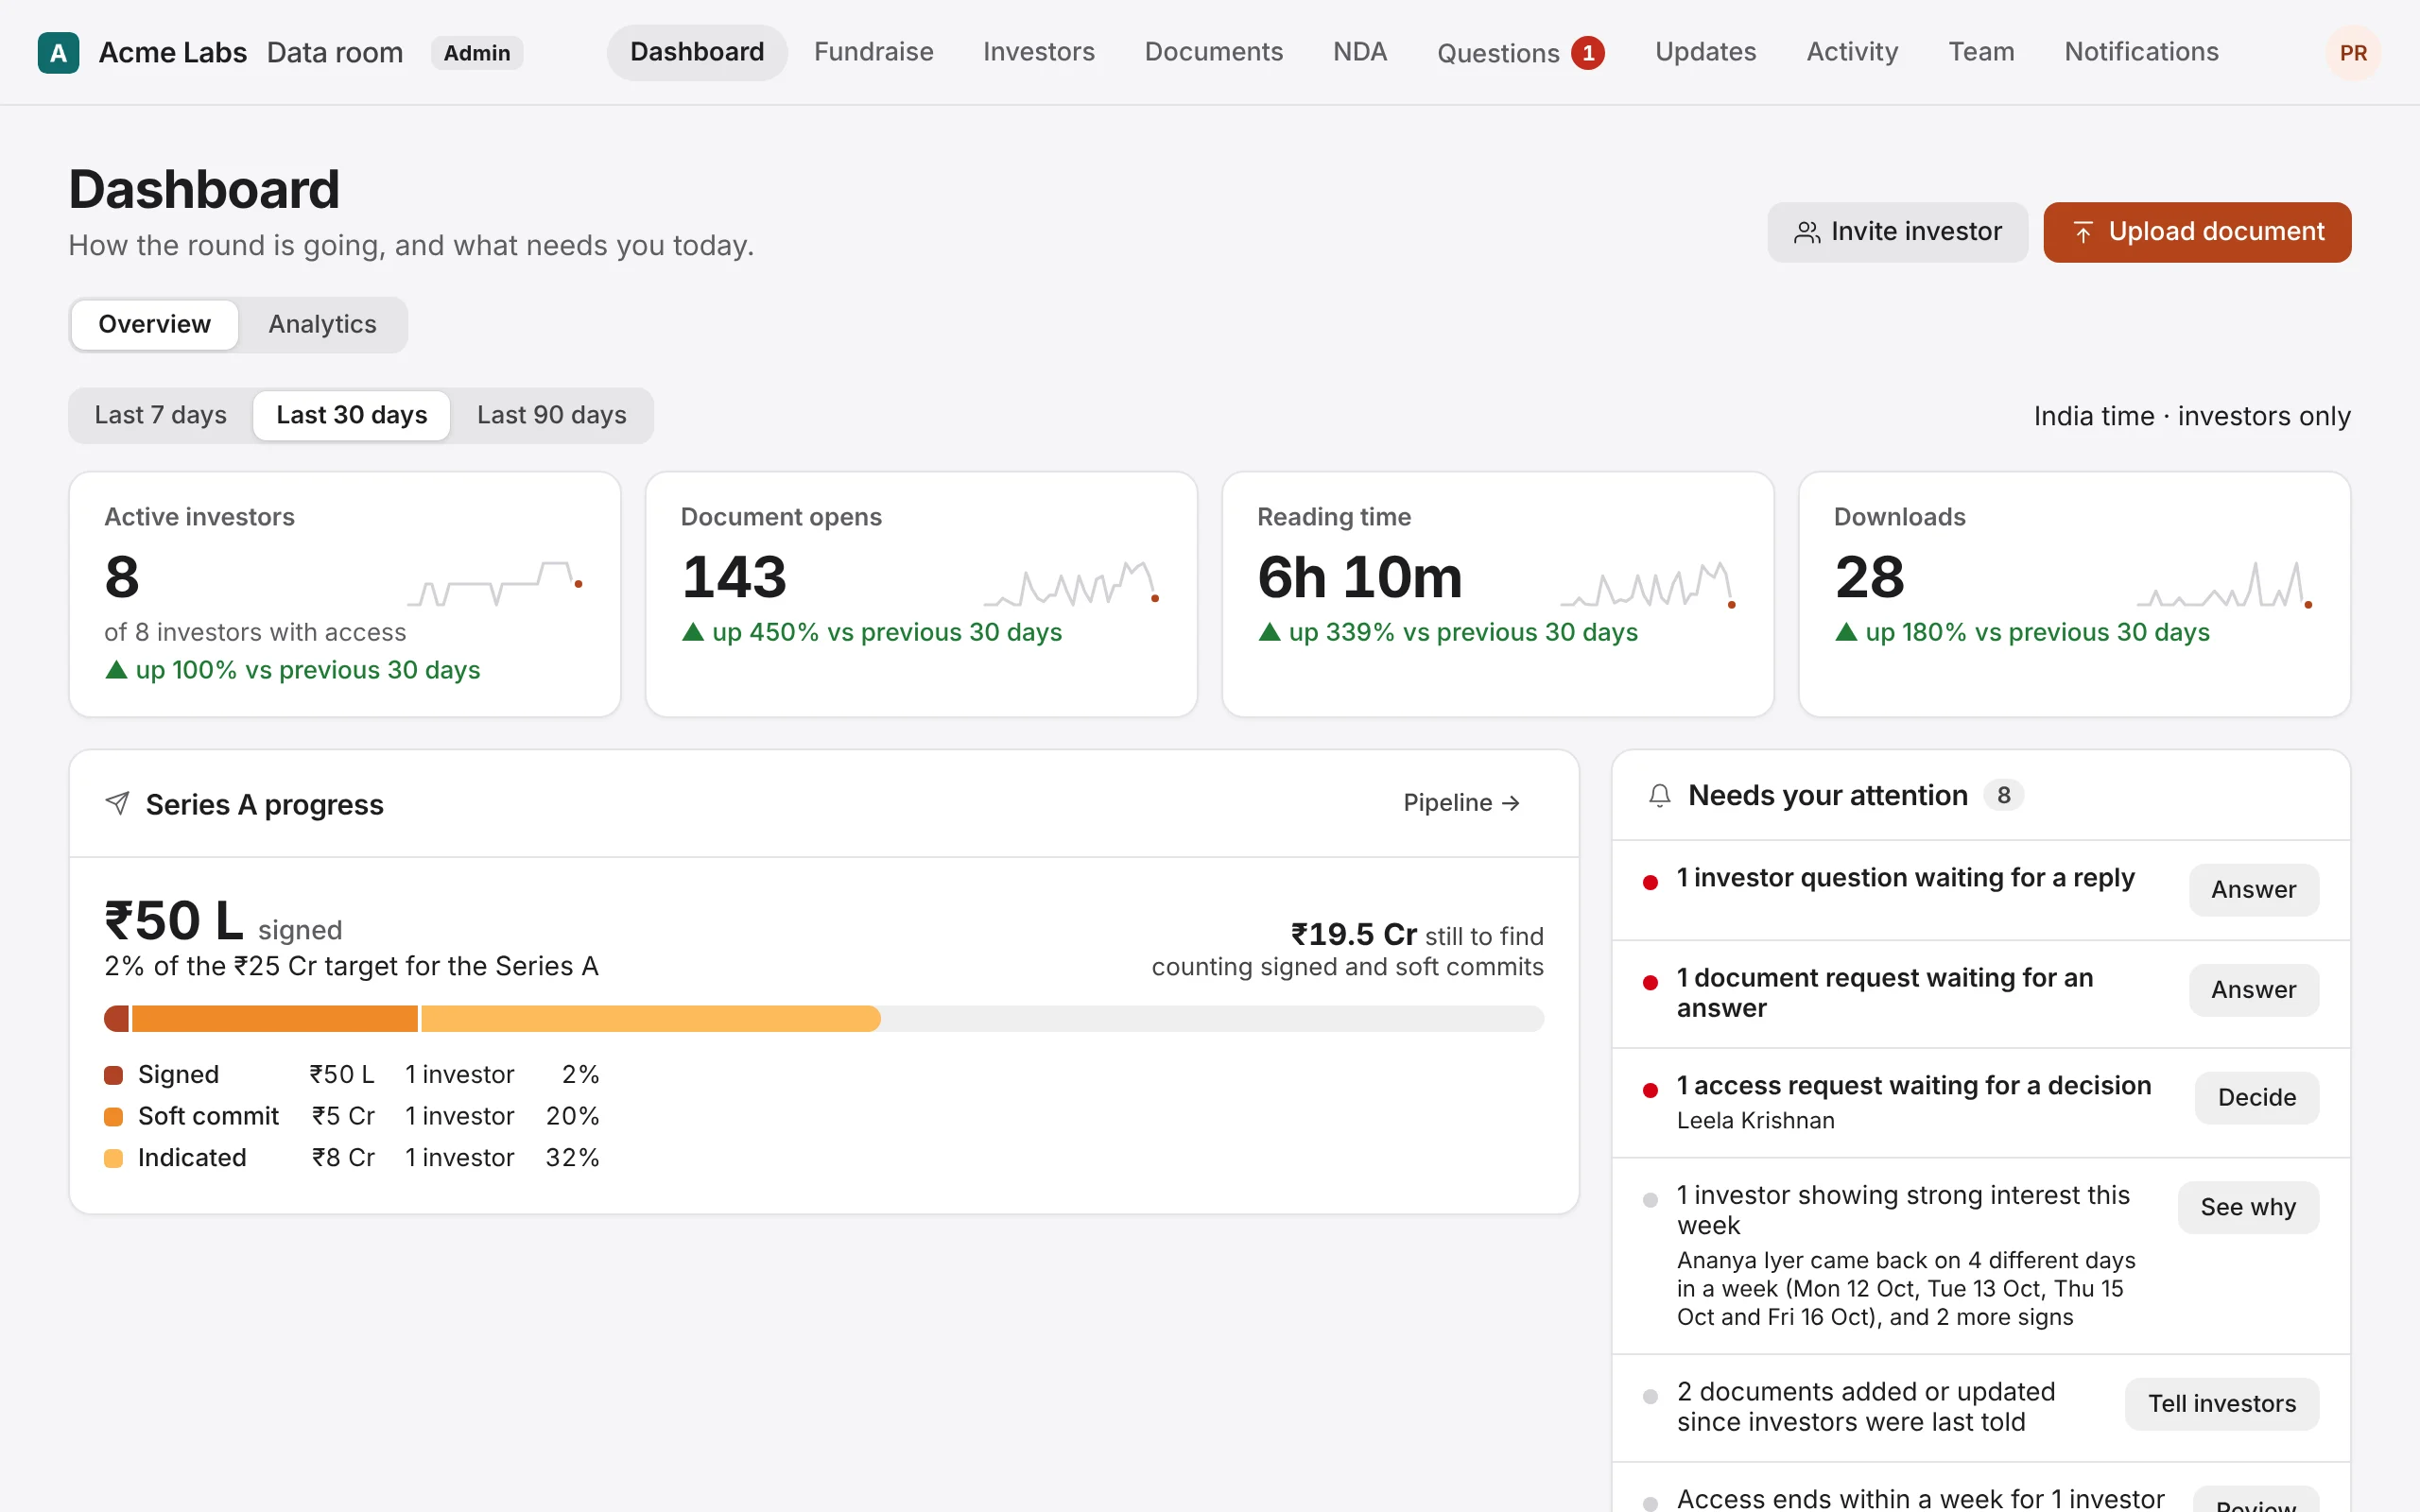
What does the Dashboard show?
For the last 7, 30 or 90 days: active investors, document opens, reading time and downloads, each compared with the period before. Then a chart of opens per day, the most engaged investors, the most-read documents, your round's progress, the room's health (NDA, unshared documents, checklist, pending invitations) and the latest from investors.
Only investors count. Your team's own reading is never included.